DATE PUBLISHED: July 4, 2023
U.S. CEO Compensation Advantage Grows vs. U.K. Peers
The pay gap between CEOs in the S&P 500 and U.K.’s FTSE 100 widened from 2018 to 2022, with the growing advantage for U.S. chiefs largely driven by long-term incentive plans (LTIPs) and corresponding pay opportunity levels for S&P 500 companies. Corporate growth, both in terms of market value and revenue, was significantly higher on the U.S. side of the Atlantic during the period.
In this analysis, ISS Corporate Solutions highlights several key differences in CEO compensation between the U.S. and the U.K. We examined company-disclosed pay by members of each index, limiting our research to businesses where the same CEO has served during the entire five-year period.
Key Takeaways:
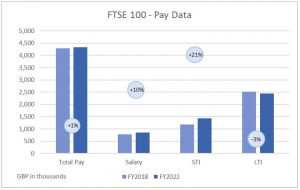
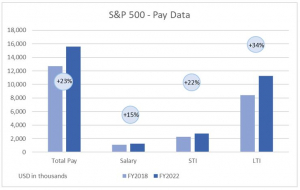
- Median CEO pay for S&P 500 CEOs increased by 23% during the period, compared with a 1.1% rise in the FTSE 100.
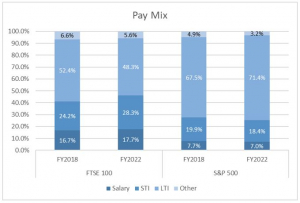
- In the S&P 500, the LTI component of total CEO compensation increased, while among FTSE 100 companies, base salary and annual bonus together increased more rapidly.
- The transatlantic disparity in basic CEO salary and annual bonuses, when adjusted for both market cap and revenue growth, has decreased since 2019.
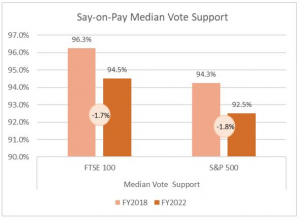
- Median vote support levels for say-on-pay proposals have dropped by 1.8 percentage points in the U.K. and 1.7 points in the U.S.
The gap in total CEO pay between S&P 500 and FTSE 100 companies continues to make headlines. Recent comments made by Julia Hoggett, CEO of the London Stock Exchange, regarding the need for commensurate levels of CEO pay on both sides of the Atlantic highlight continued efforts to draw attention to this issue.
S&P 500 CEOs saw total compensation rise by 23% vs. 1% for the FTSE 100 during the period under review.[1] Breaking this down into components of pay, the median S&P 500 CEO salary grew 15% vs. 10% for the FTSE 100; annual bonuses increased 22% among S&P 500 CEOs vs. 21% for FTSE 100 CEOs. The most striking difference was long-term Incentive (LTI) pay, which grew 34% for the S&P 500 CEOs, while dropping by 3% at FTSE 100 companies.
Source: ISS Corporate Solutions, all data as of 5th June 2023
The rise in LTIs and resulting change in pay mix means FTSE 100 CEO pay is increasingly cash-based (salaries and bonuses), while S&P 500 CEO compensation depends much more heavily on sustained share-price performance (LTI). In 2022, 71.4% of compensation for S&P 500 CEOs was LTIs.
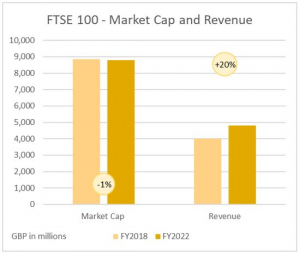
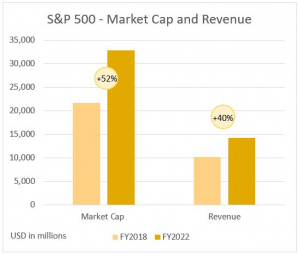
While many factors may contribute to the growing pay disparity, S&P 500 companies have outperformed their FTSE 100 counterparts both in terms of market cap (value creation) and revenue growth. Median market cap and revenue among S&P 500 companies witnessed 52% and 40% growth, respectively, while among their FTSE 100 brethren, market-cap levels remained flat despite a 20% rise in revenue.
It should also be noted that the S&P 500 is a more diversified index than the FTSE 100 in terms of sector exposure and the number of companies. This diversification can lead to better overall performance as it allows for the index to benefit from the growth across a broader range of sectors. The performance of the technology sector and its effect in the U.S. between 2018 and 2021 on both time-based and performance awards cannot be overlooked in this regard.
Since 2018, median vote support levels for say-on-pay proposals dropped by 1.8% in the U.S. and 1.7% in the U.K.[2] This suggests that investor dissatisfaction with pay packages (quantum and mix) has grown equally despite the disparities in corporate performance.
Notes:
[1]Based on granted pay value.
[2]This refers to the remuneration report item in UK.


